Sea Level
Change
How fast is the sea level rising?
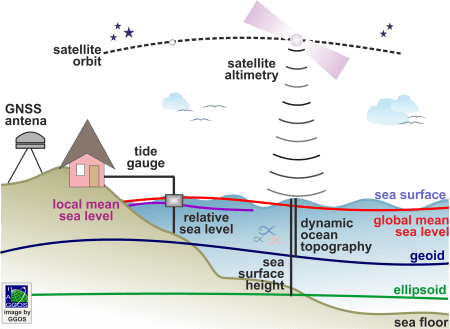
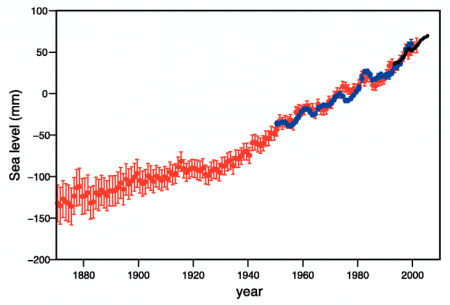
The sea level is monitored in-situ and pointwise using tide gauges, or remotely and globally using satellite altimetry techniques. Tide gauges measure sea level relatively to the ground, thus they register also ground motions. To infer sea level changes with high reliability, the vertical land motion needs to be subtracted. In the analysis of historical tide gauge data, only effects of the Glacial Isostatic Adjustment (GIA) are considered. In analysis based on recent data, the vertical land motion at tide gauge locations is determined with GNSS positioning. Although the GNSS-based vertical land motions represent short time intervals (5 to 20 years only), it is usually assumed that they represent long-term trends. Different studies based on historical or reconstructed tide gauge data agreed on a mean rate 20th century sea level rise in the range of 1.6 to 1.8 mm/yr.
The monitoring of sea level changes with satellite altimetry is relatively recent (since the early 1990s). This technique allows determining the sea surface height with respect to a reference ellipsoid or with respect to the geoid (the equipotential surface or the Earth’s gravity field that best fits the mean sea level). The latter is known as the dynamic ocean topography. Satellite altimeters cover the ocean areas with repeated tracks at repetition rates of some days up to a month and permit the estimation of sea surface heights to an accuracy of 1 to 2 cm. Geographical averaging of individual sea surface heights allows estimating a global mean sea level value, and further constructing a global mean sea level time series. As the satellites follow the same ground tracks in every repetition, it is also possible to infer local or regional sea level time series to analyse the sea level variability at short spatial scales and at different time scales. The accuracy of the global mean rate of sea level rise inferred from satellite altimetry is assessed to be about 0.4 to 0.5 mm/yr. The estimated sea level change trends differ with respect to the used data sets, the considered time span, and the processing strategies and methods.
Data Sources
Tide gauge data and vertical land motions
Satellite Altimetry
The original altimetry data measured by the individual satellite altimetry missions are provided by the responsible space agencies. Some of them also provide pre-processed sea surface heights (so-called Level-3 or Level-4 products). Refined solutions are computed by different agencies, universities and research institutes. Selected data sources are:


