Ice Sheets & Glaciers
Temporal Variations
How fast is the ice being lost in Greenland and Antarctica?
Temporal changes of the volume and mass of ice sheets and glaciers are sensitive indicators of climate change, and strongly affect the global water cycle, surface energy budget, sea level change, ocean circulation patterns, and hence global climate. A precise monitoring of the behaviors of these ice bodies is essential for improved understanding of the Earth’s system, and interactions between its sub-components. Apart from this scientific motivation, these investigations are also highly relevant to society, since phenomena such as the global sea level rise are largely driven by accelerated melting of the Greenland and Antarctica ice sheets and glaciers, and could be catastrophic for millions of people in the future.
With observations from dedicated satellite gravity missions (CHAMP, GRACE, GRACE Follow-On, and GOCE), as well as remote sensing techniques from satellites and aircrafts, a precise monitoring of the mass and volume changes of the ice sheets and larger glaciers is now possible. The three following methods are currently applied to measure the mass balance and volume changes of these ice bodies:
- comparing net snow accumulation (assessed by atmospheric modeling) with ice discharge to the ocean by glacier flow, assessed through measurements of glacier flow velocities by interferometric SAR (InSAR);
- using altimetry over the ice surface to measure changes of the thickness of ice sheets and glaciers from radar (e.g., Cryosat) and laser (e.g., ICESat) altimeters (geometric method);
- measuring temporal gravity changes based on data from satellite gravity missions, directly providing estimates of mass change and mass transport (gravimetric method);
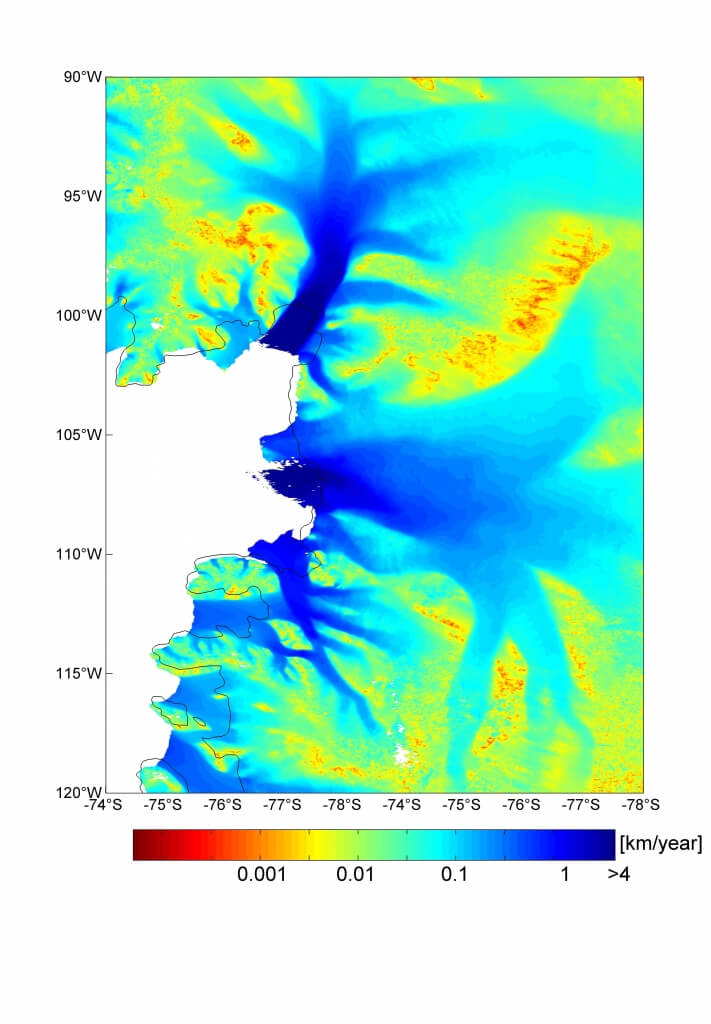
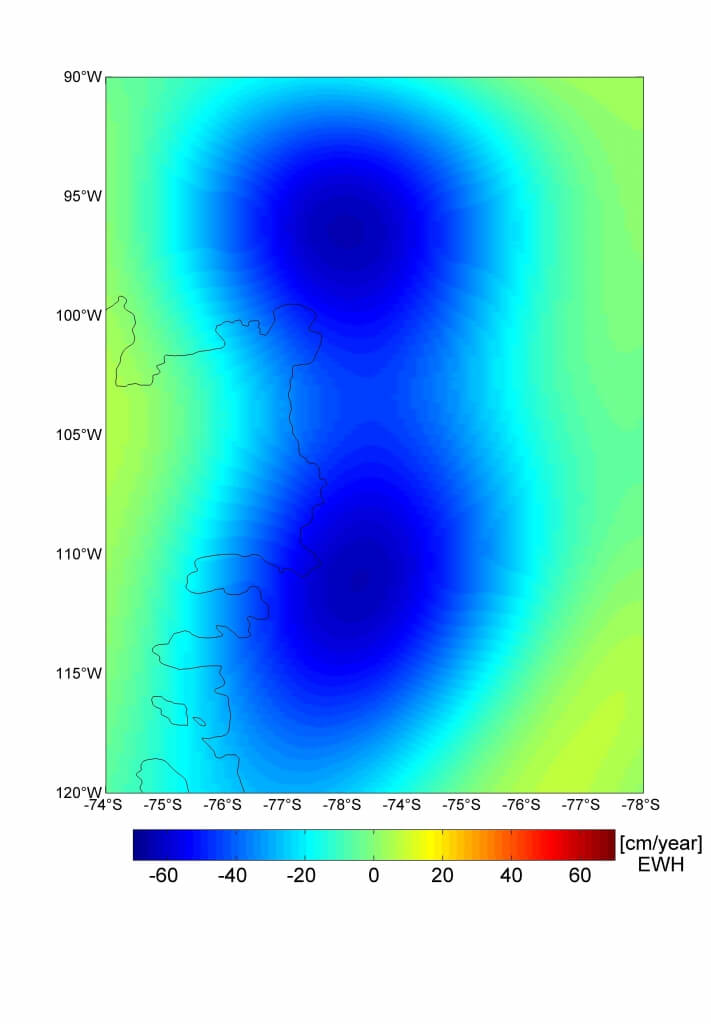
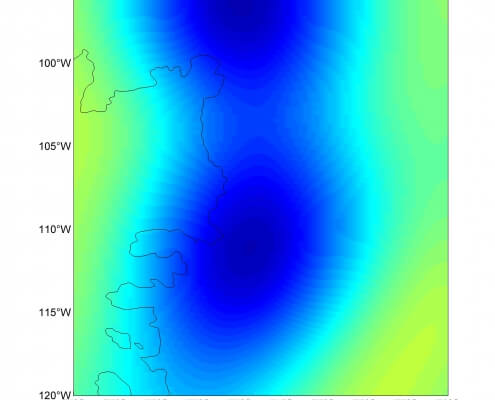
Both, the geometric and gravimetric methods require the correction for changes in the elevation of rock beneath the ice. This is not necessary for the first method, which however relies on assessing the small difference between two large quantities, each with considerable uncertainty. Since the gravimetric method is limited by a spatial resolution of about 200 to 300 kilometers with current satellite missions, it does not allow for monitoring mass changes of smaller glaciers (see right figure below).
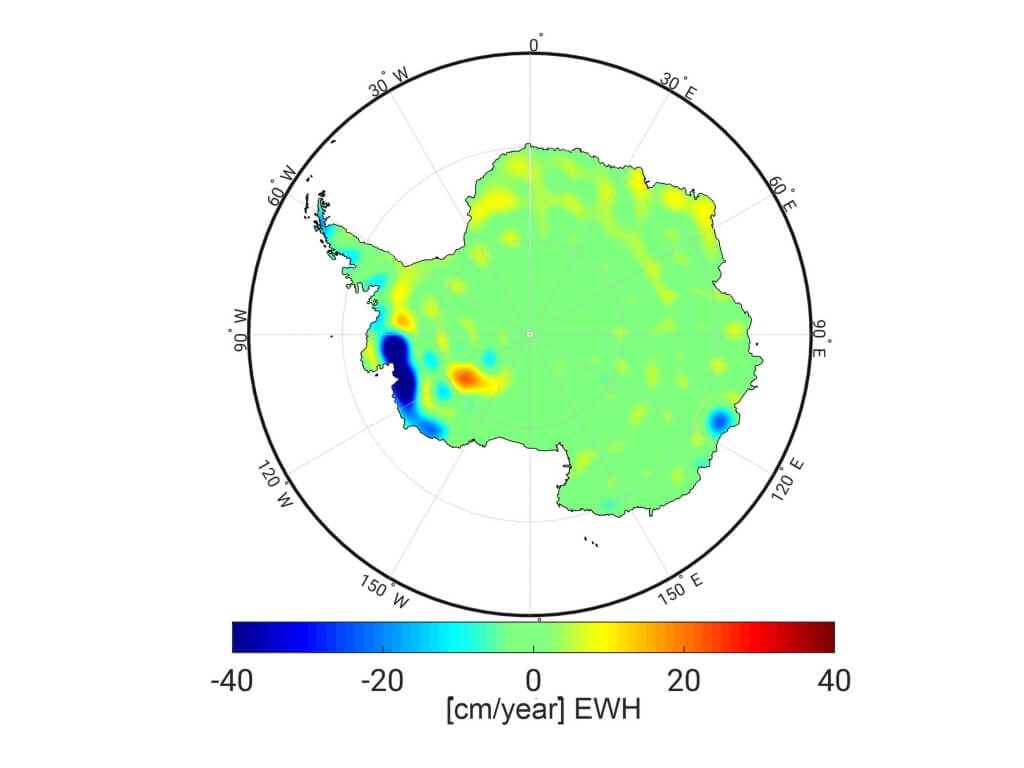
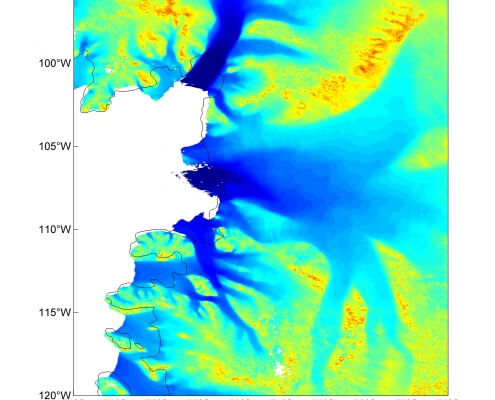
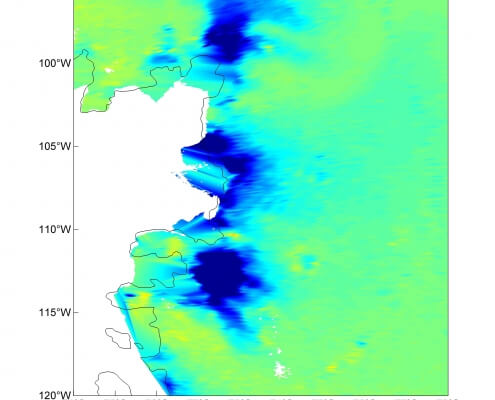
As an example, results of these three methods are shown for an outlet glacier system in the Amundsen Sea embayment in West Antarctica, comprising the Pine Island glacier and the Thwaites-Haynes-Pope-Smith-Kohler glacier complex. This outlet system is of great interest to scientists because it is changing rapidly; it is thinning, accelerating and receding, all of which contribute directly to sea level rise.
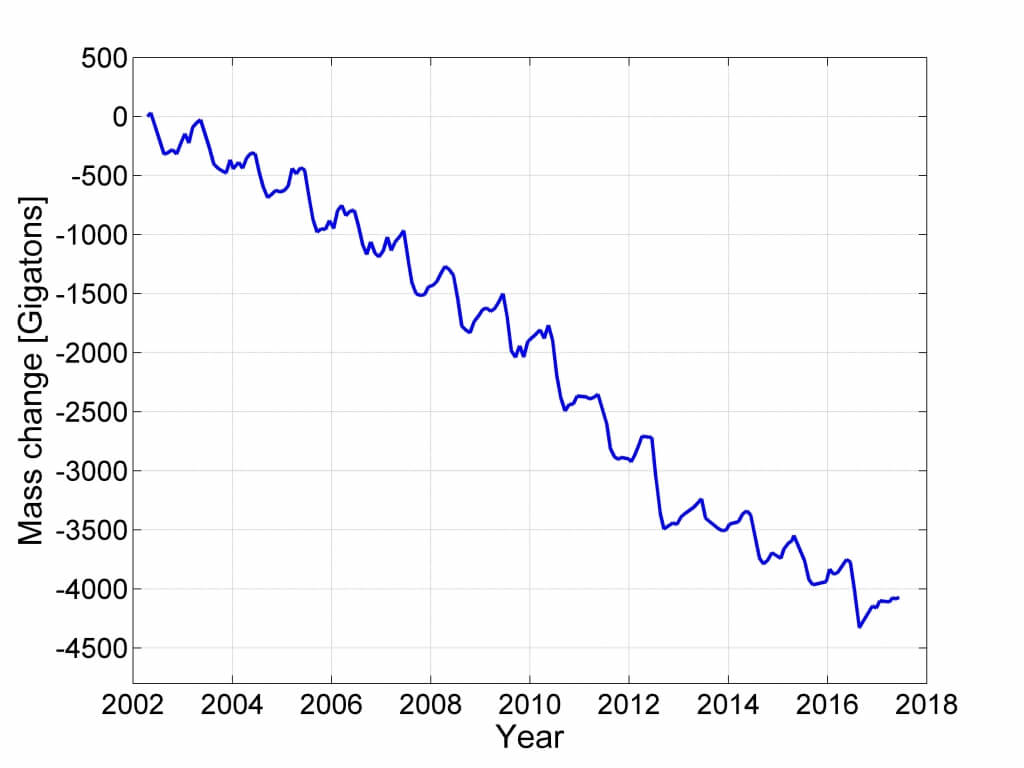
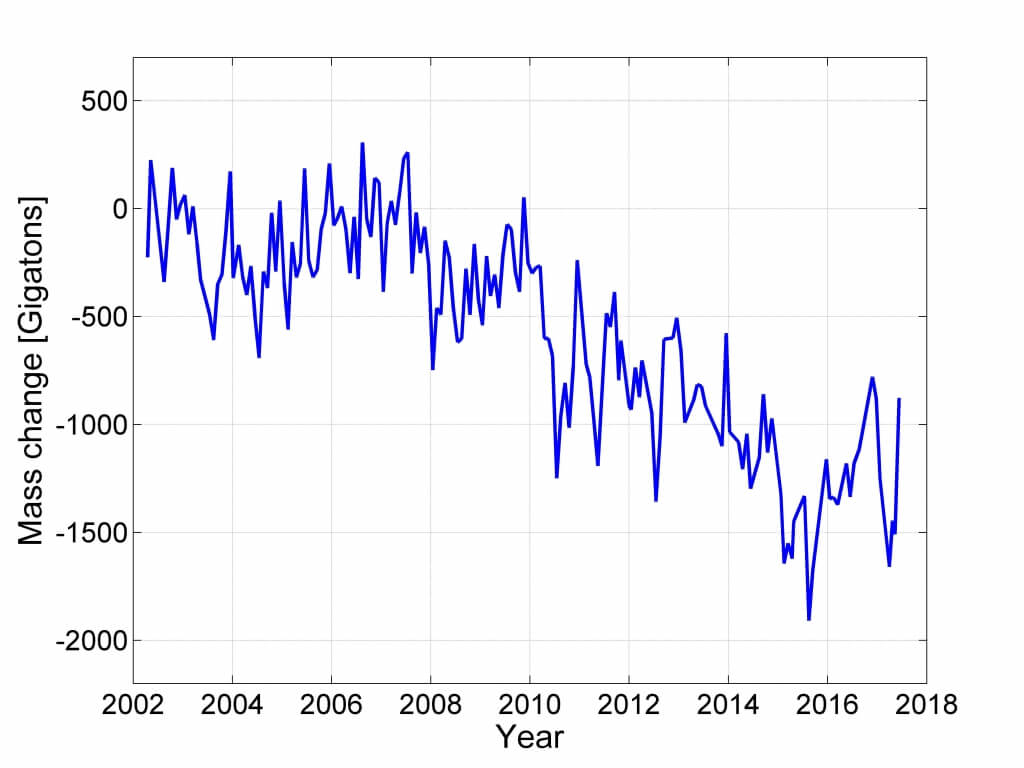
The results obtained from the three different methods show a high level of agreements for the ice mass and volume changes (The IMBIE team, 2018 and 2020). The mass changes are shown for the Greenland and Antarctic ice sheets (see in top), derived from more than 15 years of GRACE data. In Greenland, the ice masses decrease significantly, particularly at the ice sheet margin. The time series show a negative trend of ice masses in the order of almost 300 billion tonnes per year with a pronounced annual signal. The situation is different in Antarctica: There are regions in East Antarctica with an increase of ice masses, whereas the much larger mass loss in West Antarctica (primarily in the Amundsen Bay embayment) leads to an overall decrease of ice masses in Antarctica of about 125 billion tonnes per year. From 2009, the time series for the mass changes in Antarctica show an increased negative trend, which is mainly caused by mass loss in West Antarctica. The results do not show a clear annual signal and the estimates are less accurate than those of Greenland, since the required corrections for vertical crustal motions due to glacial isostatic adjustment (GIA) have a larger impact and the GIA models are less accurate (in Antarctica).


